Reading Google Analytics | A Beginners Guide
You Installed the Tracking Code, Nice! Now, What Should You Watch?
“What gets measured gets improved.” Google Analytics is an amazing tool for tracking visitor activity on your website. A good-looking site is nice, but what’s better is knowing who is visiting, for how long, which pages they view and leave, and what areas get the most attention.
[bctt tweet=”A good-looking site is nice, but what’s better is knowing who is visiting, for how long, which pages they view and leave, and what areas get the most attention.” username=”@DawnDes”]
The comprehensive and easy-to-interpret information that Google Analytics provides will allow you to dial in your marketing efforts, grow your ideal audience, and ultimately boost revenue.
When first starting out, you’ll probably see a mountain of data begin to form. This is overwhelming, especially if you don’t yet know how to make sense of it all! To make things quick and easy, we’ll show you the 3 most important sections for a small business owner to focus on for optimal growth.
Note: A tracking code is a piece of JavaScript that you paste into your website’s header section to begin transmitting information from your site to your Google Analytics. If you haven’t installed the tracking code, read this →
What Should A Beginner Focus On?
If you’re completely new to the world of Google Analytics, it may be a good idea to explore and get familiar with the lay of the land. Click around, check out pages, and maybe do some research. You might stumble upon surprising trends you wouldn’t have noticed before.
When you first log in, you land on the home screen, which gives a full overview of your website activity from the previous 7 days (or whichever range you choose). To dive in and get a deep understanding of what is happening in your site to start making strategic changes, let’s focus on these 3 tabs:
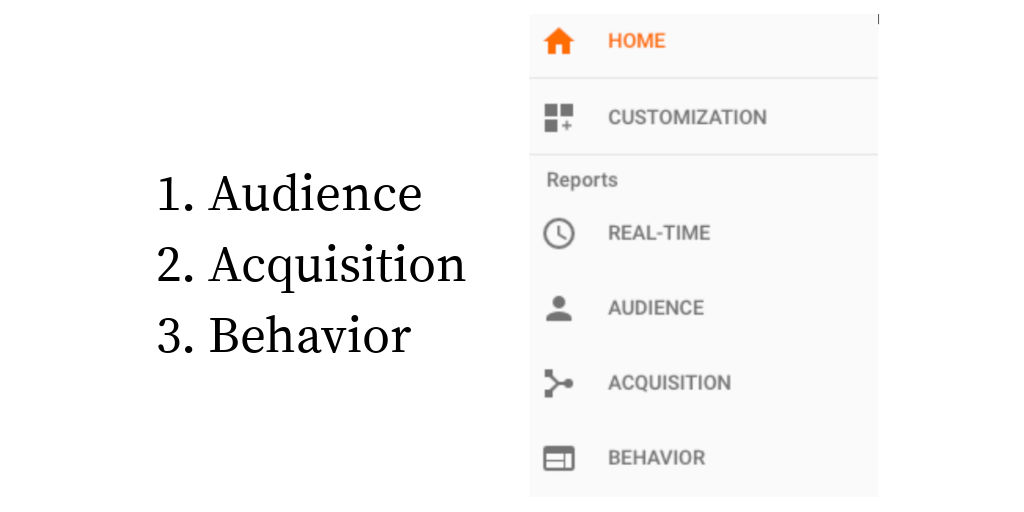
We will pinpoint specific areas to focus on under each of these tabs so that you can immediately begin making strategic changes.
Audience
The first tab you’ll want to visit when logging into your Google Analytics is Audience.
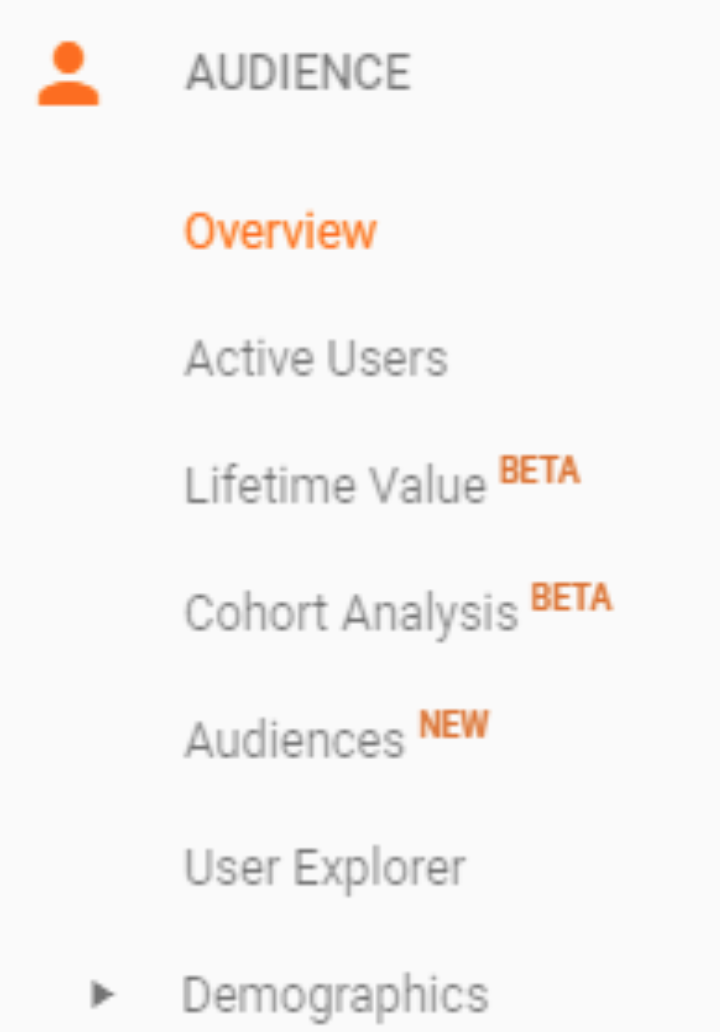 Overview: Provides in-depth information about visitors to your website, allowing you to see how often people visit, when and how often they come back, and how long they spend on your website.
Users: Accounts for all visitors, both new and returning, that are coming to your site. Every time your website is visited on a different browser or device, even if it’s the same person, a new tracking ID, or New User, is created.
When the same user revisits, this counts as a Returning User. If you’re trying to drive more traffic to you site, this data will let you know if it’s working based on how many new users you have. It will also tell you how loyal your visitors are based on how often they return.
Avg. Session Duration: The average time a user spends on your website. It’s ideal to keep relevant searches on your page at least 30 seconds. Did they click around and browse your site or just scan the page and split?
Bounce Rate: A session with 0 seconds, meaning the user only visited one page and left immediately without interaction. If users come to your site and bounce right back to the search results as fast as they can, this tells Google you were not the right answer to their query. This is fine* if you don’t sell what they were looking for, but devastating if you do. (*WHY are you attracting invalid traffic?)
Acquisition
Next, you’ll want to dive into the Acquisition section.
All Traffic: In short, this section states how you acquired your website visitors. Did they come from certain search engines? Other websites? Social media? This will help you determine where to focus your marketing efforts the most.
Channels: Similar to the Overview section in that it displays which channels drive traffic to your site and at what frequency. This will allow you to see which channels are working the most.
Source/Medium: Provides exactly where and from which website your traffic came from. This is extremely important because, again, it shows you where your marketing efforts are benefitting you.
Referrals: Displays which other websites are referring you and to what extent these efforts are building your website traffic. It will determine what is and isn’t working for you, especially if you’re relying heavily on referrals.
Search Console: This section displays Search Console Data such as “queries” and “landing pages” and is a somewhat more advanced section to set up initially.
If you click on (any) tab under search console it will alert you it isn’t set up by showing “no data” – and it will prompt you to connect. Doing so is highly encouraged! Be sure to claim the exact URL match.
The data you get regarding your organic search queries is unmatched. What is a “query”? The literal words a searcher typed in to get your website as a result (!) as well as the clicks, impressions, CTR and your page rank for each word. This is INVALUABLE.
Social: Measures the flow of social media to your website. This allows you to see how effective your social media marketing efforts are and how to tweak them for optimal traffic.
Campaigns: If you are running PPC campaigns, this section will automatically populate with keyword and referral information. But you can also set it up to record other events such as email leads.
Setting up email protocol is a more advanced method, but many email managers, such as Mailchimp, make this easy.
Campaigns are a great place to evaluate cost analysis and keyword efficiency.
Behavior
Finally, check out the Behavior tab.
Overview: Provides specifics about which pages are visited the most, for how long they are used, from which pages visitors leave, and so on. This might just be one of the most important sections for determining how to tweak your website for optimal visitor interaction.
Page views: Total number of pages viewed during a set amount of time.
Unique Pageviews: How many sessions during which a specific page is visited.
Avg. Time on Page: Average amount of time a visitor spends on a particular page.
Bounce Rate: Percentage of 0-second or single-page sessions without interactions.
Exits: Percentage of exits on a particular page.
Behavior Flow: This excellent tool provides a visual flow chart that shows how visitors travel through your website.
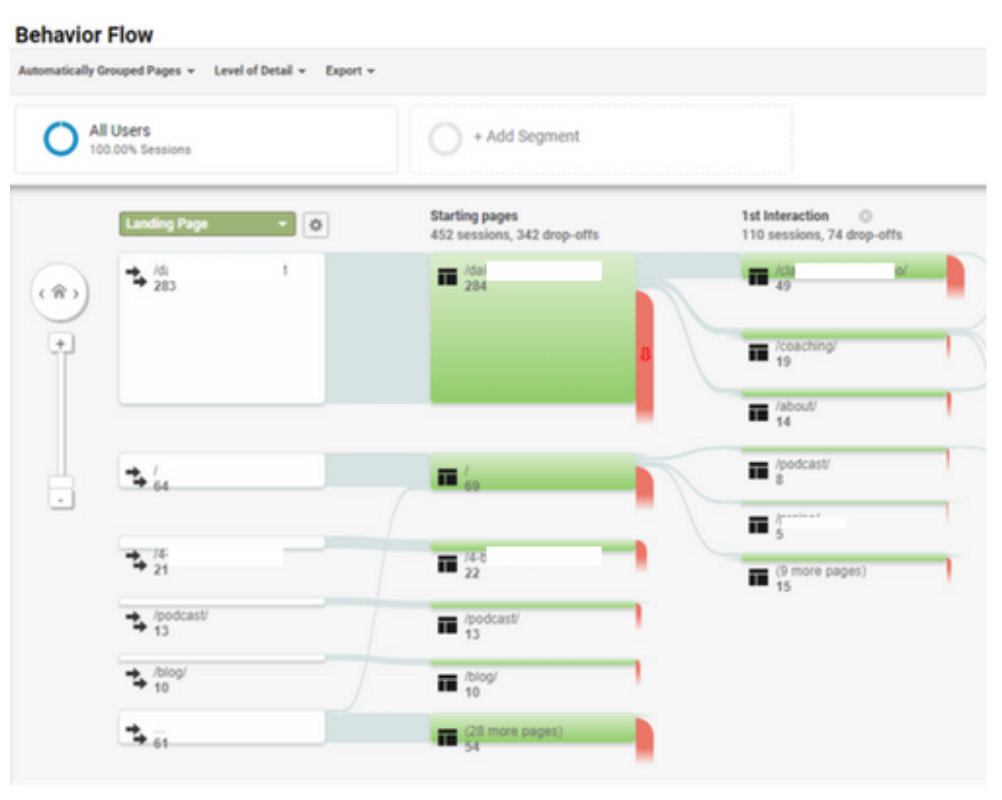
Did they go from the blog to the home page?
Or from the about page to the contact section?
Did they go to the blog then immediately leave?
Did they go from one blog to another?
Knowing how long someone stayed on a page and which pages they traveled to, you can decide on special strategies for redirecting visitors. You can also create copy based on their interests.
Site Content: Provides more detailed information on specific interactions by page. This will help you evaluate and determine what didn’t work and where to focus your greater efforts.
Content Drilldown: If you want to know how many of your visitors went to a specific page, this is where you would look.
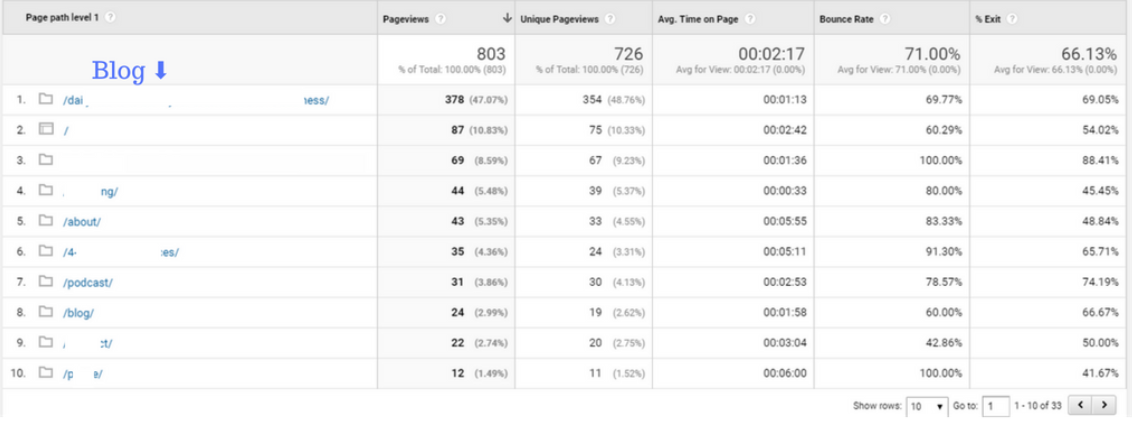
The example above shows a blog post as the most traveled to page on the entire site. It even ranked higher than homepage! (The homepage of a site is usually the most visited & linked-to page).
What does this tell us? This page is driving most of her traffic – by a LOT – and we should produce more content along this vein.
Ultimately, Google Analytics is an extremely powerful and free asset for tracking in-depth and precise data regarding your website. It is an incredible tool for understanding the psychology behind visitor interaction with particular pages.
By watching and comprehending audience activity, you can determine how to tweak and shift your efforts to grow and direct traffic to your site.
 Dawn DeSantis is the founder of Afflatus Media, SEO nerd who loves to get wrapped up in solving complex problems. Dawn chose the name “Afflatus” because she is inspired to creativity by the problems her client comes to her to solve.
af·fla·tus /əˈfleɪtəs/ noun. an impulse of creative power or inspiration, esp in poetry, considered to be of divine origin. A breath of fresh air
Follow Dawn on Twitter


